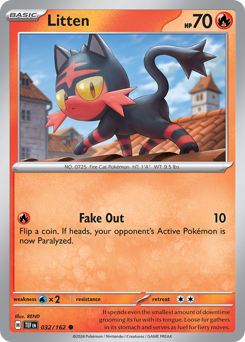
Normal · Near Mint
$0.16
TCGplayer market price (an average of recent sales)
As of Oct 24 (yesterday).
Change
For the Normal printing.
Affiliate links. Qualifying purchases may earn tcgvibes.com a commission.
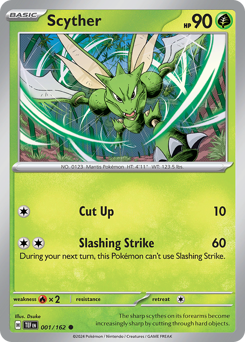
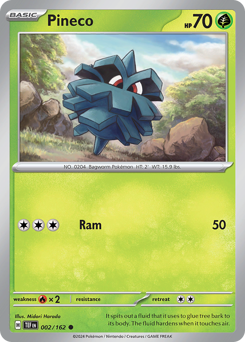
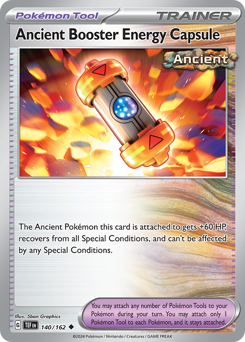
Related cards
Price trend
Oct 17 $0.19 → Oct 24, 2026 $0.16 −15.8%
Sep 24 $0.14 → Oct 24, 2026 $0.16 +14.3%
Jul 26 $0.12 → Oct 24, 2026 $0.16 +33.3%
Oct 24, 2025 $0.07 → Oct 24, 2026 $0.16 +129%
Mar 14, 2024 $0.49 → Oct 24, 2026 $0.16 −67.3%
Record
Price history Mar 14, 2024 to Oct 24, 2026
Price changes, last 30 days
| Date | Price | Change | |
|---|---|---|---|
| Oct 16 | $0.20 → $0.19 | −5.0% | Show on chart |
| Oct 19 | $0.19 → $0.17 | −10.5% | Show on chart |
| Oct 21 | $0.17 → $0.18 | +5.9% | Show on chart |
| Oct 22 | $0.18 → $0.16 | −11.1% | Show on chart |
| Oct 23 | $0.16 → $0.15 | −6.3% | Show on chart |
| Oct 24 | $0.15 → $0.16 | +6.7% | Show on chart |
Latest 6 of 16.
Vs its set
Over the 90 days to Oct 24, 2026: the Normal printing +33.3%; the median other card in Temporal Forces 0.0% (218 others). 201 of those 218 changed price, but no more than half rose and no more than half fell, so the middle change is 0%.
Litten cards
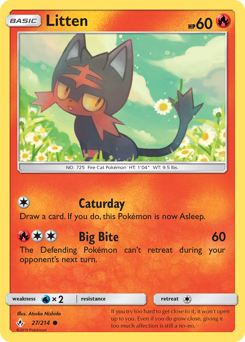
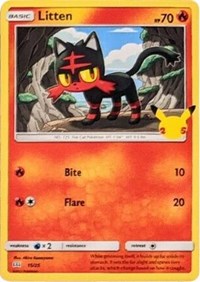
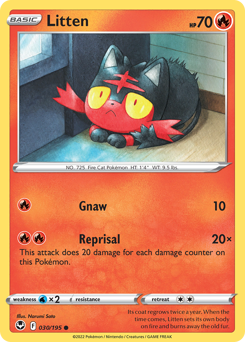
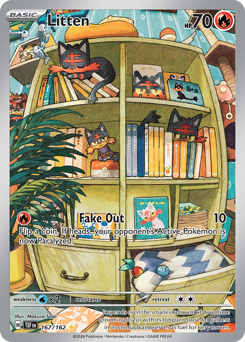
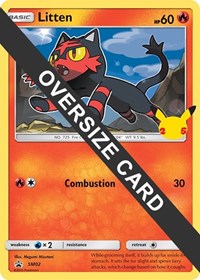
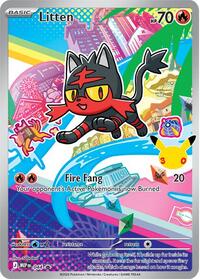
There are 19 Litten cards on tcgvibes.com, from 13 sets. Of the 11 with a release date, the oldest is Litten from SM Base Set (2017); the newest are the 2 from Temporal Forces (2024), this one included.
Keep exploring
Live market
eBay asking prices, fetched when you open this page.
Newest TCGplayer value: Oct 24, 2026. Prices in USD. Card names and images © their respective publishers. See how these prices are made.