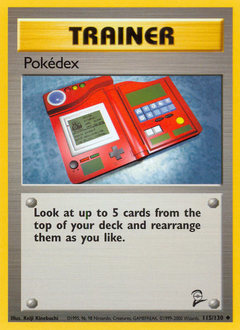
$0.65
TCGplayer market price · Normal printing
As of Sep 3.
939 days tracked · 197 distinct prices · since Feb 8 2024
Normal printing.
Affiliate links. Qualifying purchases may earn tcgvibes.com a commission.
Price trend
Normal · last 7 days · daily · $0.64 to $0.65.
Normal · last 31 days · daily · $0.60 to $0.67 · the price changed 7 times in this window.
Normal · last 90 days · one point per 2 days · $0.60 to $0.69.
Normal · last year · one point per week · $0.44 to $0.69.
Normal · one point per week · $0.35 to $0.69. Weekly points begin Feb 8, 2024; the card itself dates from 2000.
Drag across the chart to read a date range.
TCGplayer market price · Normal printing · through Sep 3
How this chart is drawn
One value a day. The 1Y and MAX views show one point a week.
TCGplayer's own chart is drawn per condition, so it can differ from this one.
Compared with its group
A gap in percentage points: this card's change minus the typical change of Pokémon cards from sets released 2000-2015 (ungraded, English), over each card's own window rather than an exact 30 or 90 days. On ~30d: this card -1.5%, the typical card +2.5%. On ~90d: this card +4.8%, the typical card +12.1%. The group spans every price level, so it is an era-and-format population, not a set of comparable cards.
Live market
eBay prices update each time you reload this page; they never enter the daily index.
Related cards

Keep exploring
Prices are TCGplayer market data, updated daily. Card names and images © their respective publishers. See how market signals are derived.